Common Workflows
These workflows cover the two things you do most often in Edgematic Studio: connecting a DevKit, and turning an idea into a running application by describing it in the chat. Both assume Studio is installed and activated - see Install and Upgrade.
If your project contains ROS 2 packages, the last section shows how to see how their nodes talk to each other without building or running anything.
Pair a DevKit
Studio deploys to DevKits you have paired with it. Pairing is done once per board.
Open the devices control in the top bar and start pairing. Studio asks for four things:
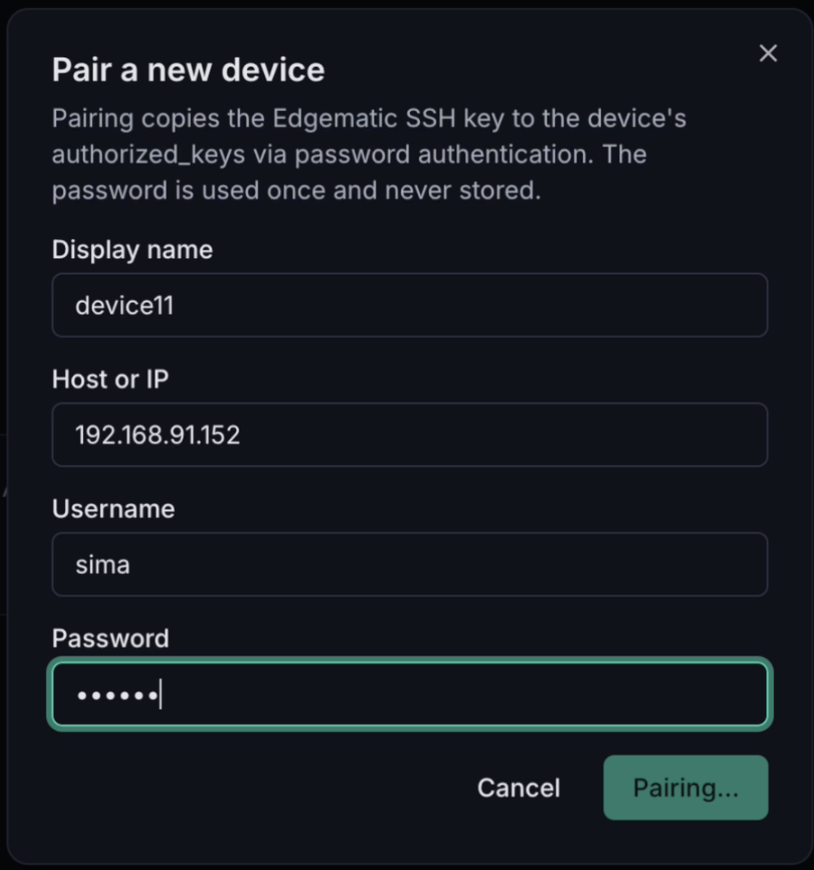
- Display name - what the board is called in Studio. This is yours to choose; it does not have to match the hostname.
- Host or IP - where the board is on your network.
- Username - the account to connect as.
- Password - used once, during pairing, and never stored.
Pairing copies Studio's SSH key into the device's authorized_keys, so the password is needed only to establish trust. Every later connection uses the key.
Check the device
Pairing ends by showing the fingerprint of the SSH key it installed on the board. Select Done to close the dialog. To check the device, open the devices control in the top bar and select View details next to it. The device opens in its own window, with the display name, IP address, and online status in the header.
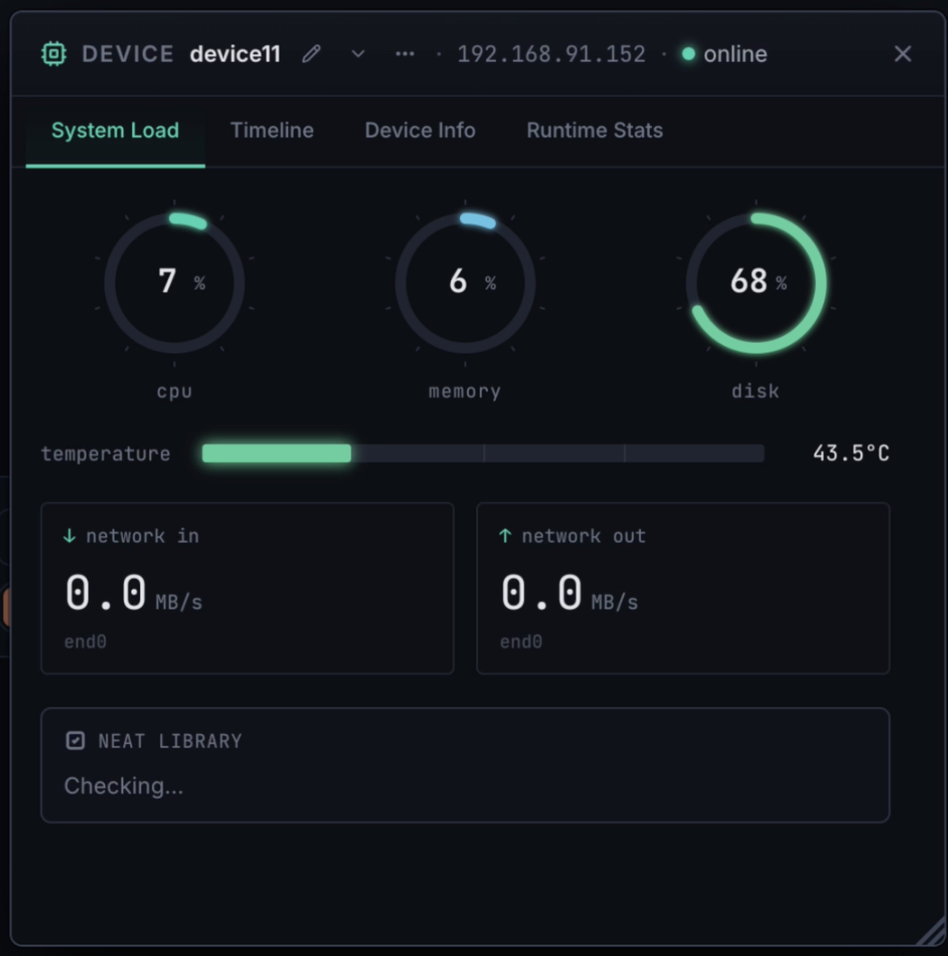
System Load is the live view: CPU, memory, and disk gauges, board temperature, and network throughput. The Neat Library card at the bottom reports the state of Neat on the board and offers the install or update action when one is needed.
Timeline plots CPU, memory, and temperature over the last few minutes, so you can see whether a spike was momentary or sustained.
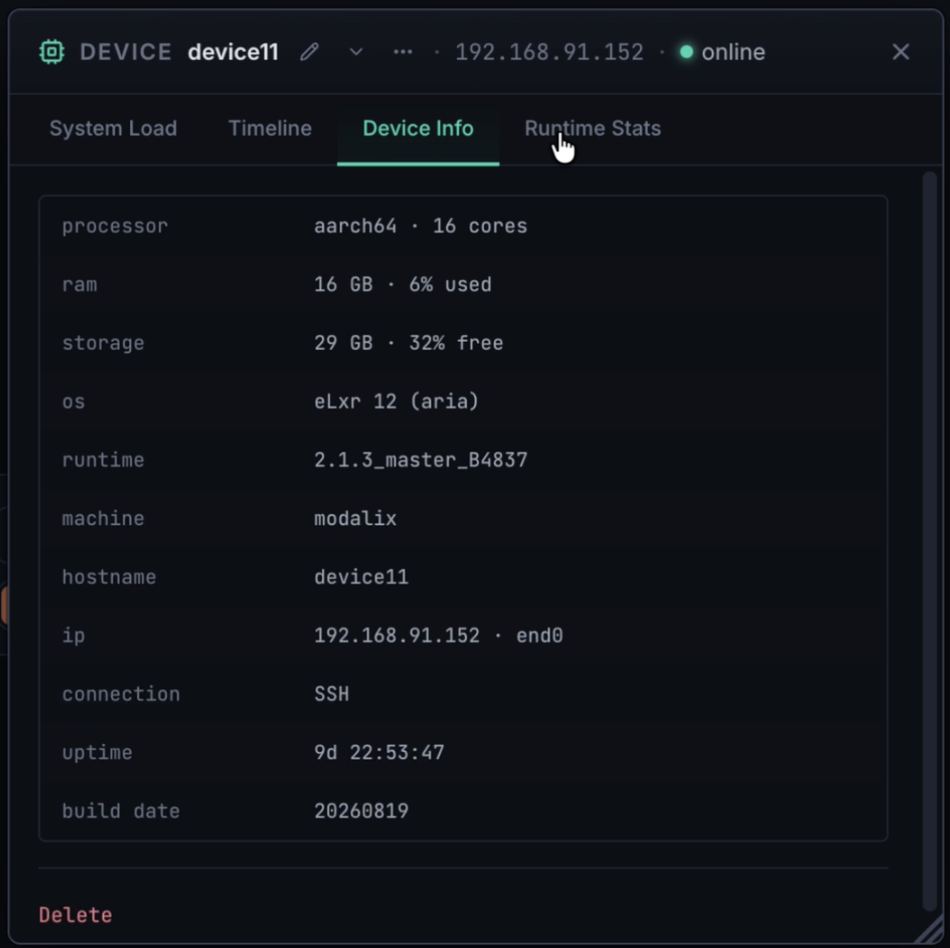
Device Info is the board's identity card - processor and core count, RAM, storage, OS, runtime build, machine type, IP and interface, connection type, uptime, and build date. This is what to copy into a bug report.
Runtime Stats shows the board's uptime and load average.
The device can be renamed from the pencil next to its name, and removed with Delete at the bottom of the Device Info tab.
Build and run an application with the agent
With a device paired, the rest of the work happens in the chat.
Describe what you want
Say what you want in plain language. No pipeline names, no file paths - the agent picks the curated starter pipeline closest to your request and adapts it.
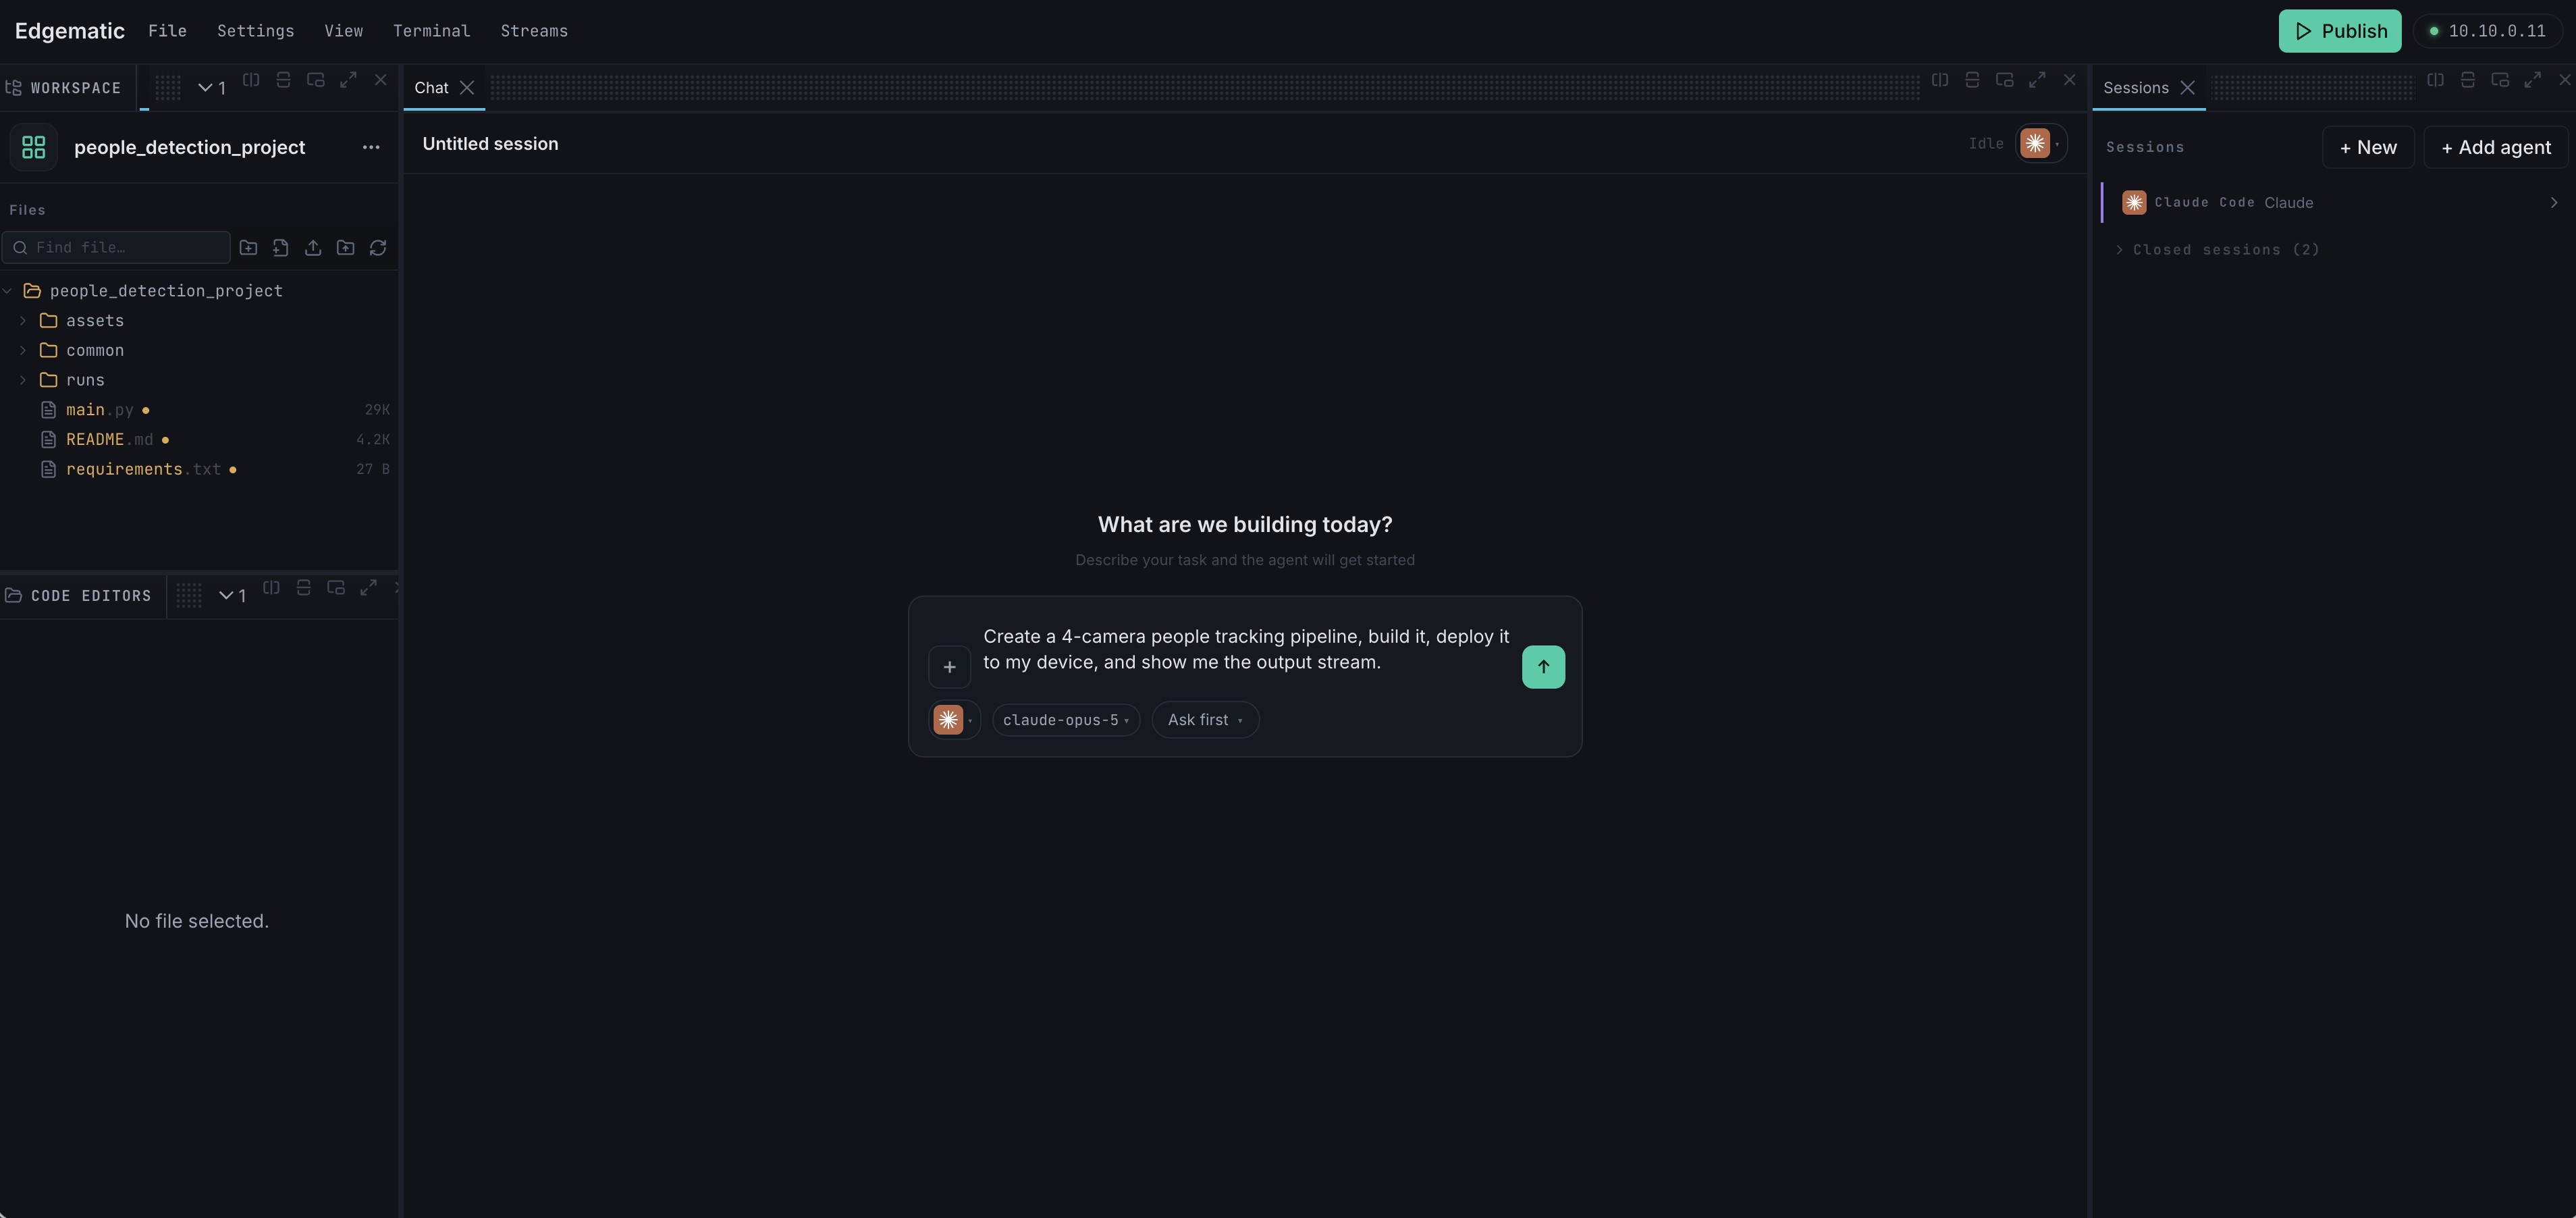
For example:
Create a 4-camera people tracking pipeline, build it, deploy it to my device, and show me the output stream.
One request can cover the whole path - build, deploy, and run - or you can go step by step and review as you go.
Choose how much the agent can do
The chip next to the model selector sets how far the agent may act on its own:
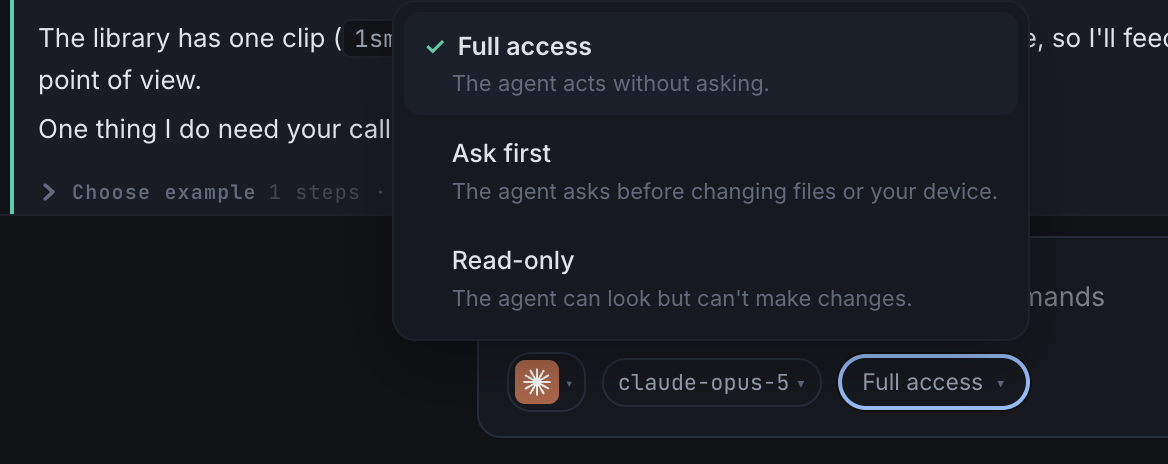
- Full access - the agent acts without asking.
- Ask first - the agent asks before changing files or your device.
- Read-only - the agent can look but cannot make changes.
For a first run end to end, Full access keeps the agent from stopping at every step. Ask first is the safer default when the agent is working on code you care about, and Read-only is for when you want an answer about the project rather than a change to it.
If you start from an empty chat, set the mode after your first message. Until a project exists there is no session to apply it to, so the chip stays on Ask first.
An agent connected with the Codex CLI also has its own shell and file editing, and these modes do not control them. Ask first and Read-only apply only to Studio's tools on that agent, so Read-only does not stop it editing a file.
Watch the output
The agent builds the application, deploys it to the paired DevKit, and starts it. When the pipeline is running, the live output appears in the chat: one tile per channel, with detections drawn on the frames.
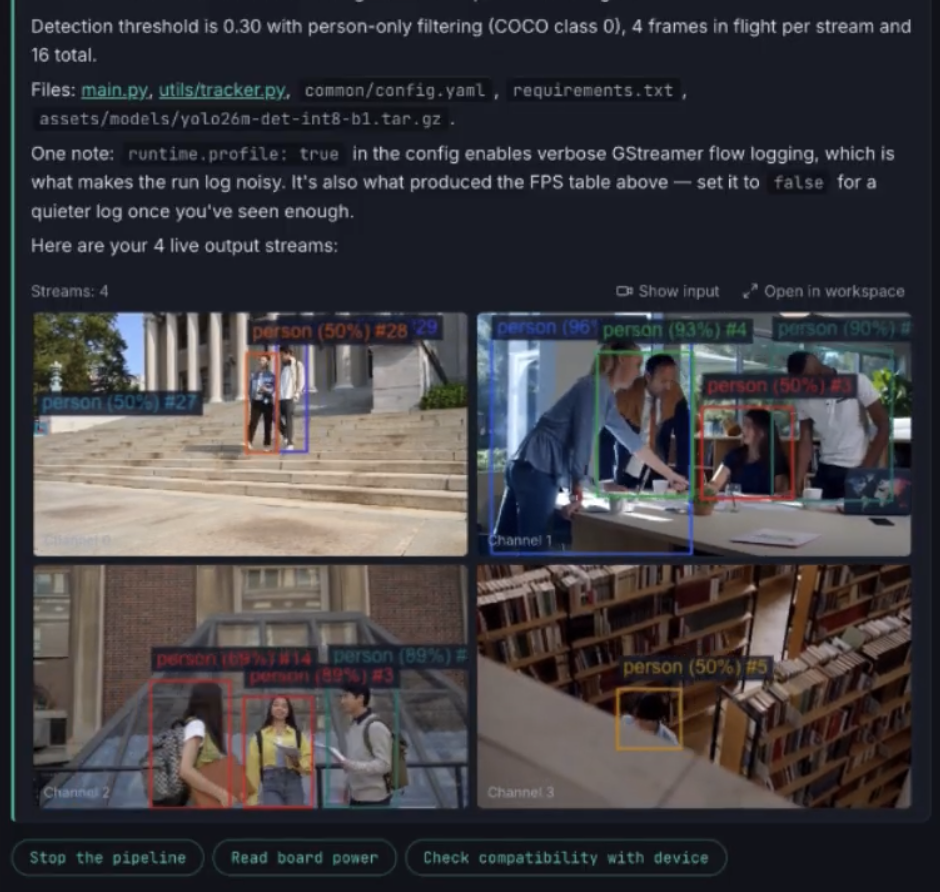
Along with the streams, the agent reports what it actually built - the detection threshold, the class filter, how many frames are in flight per stream - and lists the files it created or changed, with links into the editor.
Show input switches the tiles to the source video assigned to each channel, and Open in workspace also opens the streams in the streams panel, where they get more room.
Underneath, the suggested actions follow what is on screen - stopping the pipeline, reading board power, checking device compatibility - so the obvious next step is one click rather than a typed message.
From here you keep talking to the agent: change what it detects, swap the input, or tune the pipeline, and the output updates as it redeploys.
Inspect a ROS package
Studio can draw the communication graph of a ROS 2 package straight from its source: which nodes it contains, the topics, services, and actions they use, and which nodes in other packages are on the other end. Nothing is built, launched, or sent to a device.
Open an inspection
Right-click in the file explorer:
- a package folder (a folder that contains a
package.xml), or thepackage.xmlfile itself, shows Inspect ROS package; - the project's root row shows Inspect ROS workspace when the project contains at least one ROS package, and analyses every package in it. If the project has a top-level
srcfolder, only packages inside that folder are analysed.
The items appear only where they apply. A file that is not a package.xml, or a folder without one, has no inspect item. Search results work the same way: right-click a package.xml hit to inspect its package. When you add or remove a package.xml, the menu follows without a reload.
The inspection opens as a tab in the editor area, next to your files, titled with the package name (or the project name for a workspace).
Read the graph
The graph opens on the communication view. The tabs above it switch to the dependency view and to the full view, the sidebar filters by name or by kind and lists the analyser's diagnostics, and the selector beside the tabs changes the layout. Selecting an element shows its details. The graph follows Studio's light or dark theme.
For a package, the communication view shows the package's own nodes, everything they publish, subscribe to, provide, or call, and the nodes in other packages on the other side of those connections. Studio analyses the whole colcon workspace the package belongs to, so connections to its sibling packages are found.
Click a node or a connection to open the source file that declares it in the editor, scrolled to the declaring line when the analysis knows it. Topics and packages have no single source file, so clicking them only selects them.
Static analysis is a lower bound
The graph is what can be read from the source without running it, so it may miss connections that exist at runtime:
- a topic or service name that is computed only at runtime - from a parameter, a remapping, or a string built in code - cannot be known in advance. Its endpoint is drawn with a dotted outline and stays unconnected, because the analysis cannot tell which node is on the other end;
- an element that depends on a condition the analysis cannot evaluate, such as a launch condition, is drawn with a dashed line;
- nodes started in ways the analysis does not recognise, such as some composable-node launch files, do not appear at all.
The banner above the graph says so, and counts the endpoints that could not be resolved, for example 2 of 14 endpoints unresolved. For a package, those counts cover only that package's view.
Folders named build, install, log, venv, env, dist, __pycache__, and common tool caches are skipped wherever they appear, including inside a package, as are version-control folders, node_modules, files reached through symbolic links, and files over 4 MB. A ROS node kept in one of those folders is not shown.
Re-run
The toolbar shows when the analysis ran and how long it took. Studio keeps the result and reuses it - marked Cached - until a file the analysis reads changes, so reopening a package is instant. A tab that is already open keeps its graph until you select Re-run, which analyses again from scratch.
If the analysis fails, does not finish in time, or finds the same package name declared twice in the workspace, the tab says which, with Re-run to try again once you have fixed the cause. If too many analyses are already running, wait a moment and choose Retry.
If the inspector is not installed
The analysis is done by the ROS inspector, which the Edgematic Studio installer sets up alongside Studio. The installer downloads it from the Python package index, so an install without network access completes without it, and every inspection then reports that the ROS inspector is not installed. Re-run the installer from a machine with network access to add it - see Install and Upgrade.