Edgematic Studio
What's in Edgematic Studio
The sections below walk through each surface of Studio - what it does, and when you would reach for it.
Workspaces
Your work lives in a workspace - the files, configuration, and session history for one application. You create a workspace before you start building, or let the agent create one for you when you describe what you want to build.
The agent and the chat
The chat is where you work. You describe the application you want, and the agent picks a curated, pre-validated starter pipeline and adapts it - editing files, running builds, and deploying to a device as needed.
Suggested actions. After the agent answers, it can offer a short row of action chips underneath the message, based on what it just told you - for example Check device status, Check compatibility with device, Manage streams, or Update device to Neat X.X after a version check. Clicking a chip acts straight away, usually by sending it as your next message, so common follow-ups don't have to be typed out.
Sessions and agents
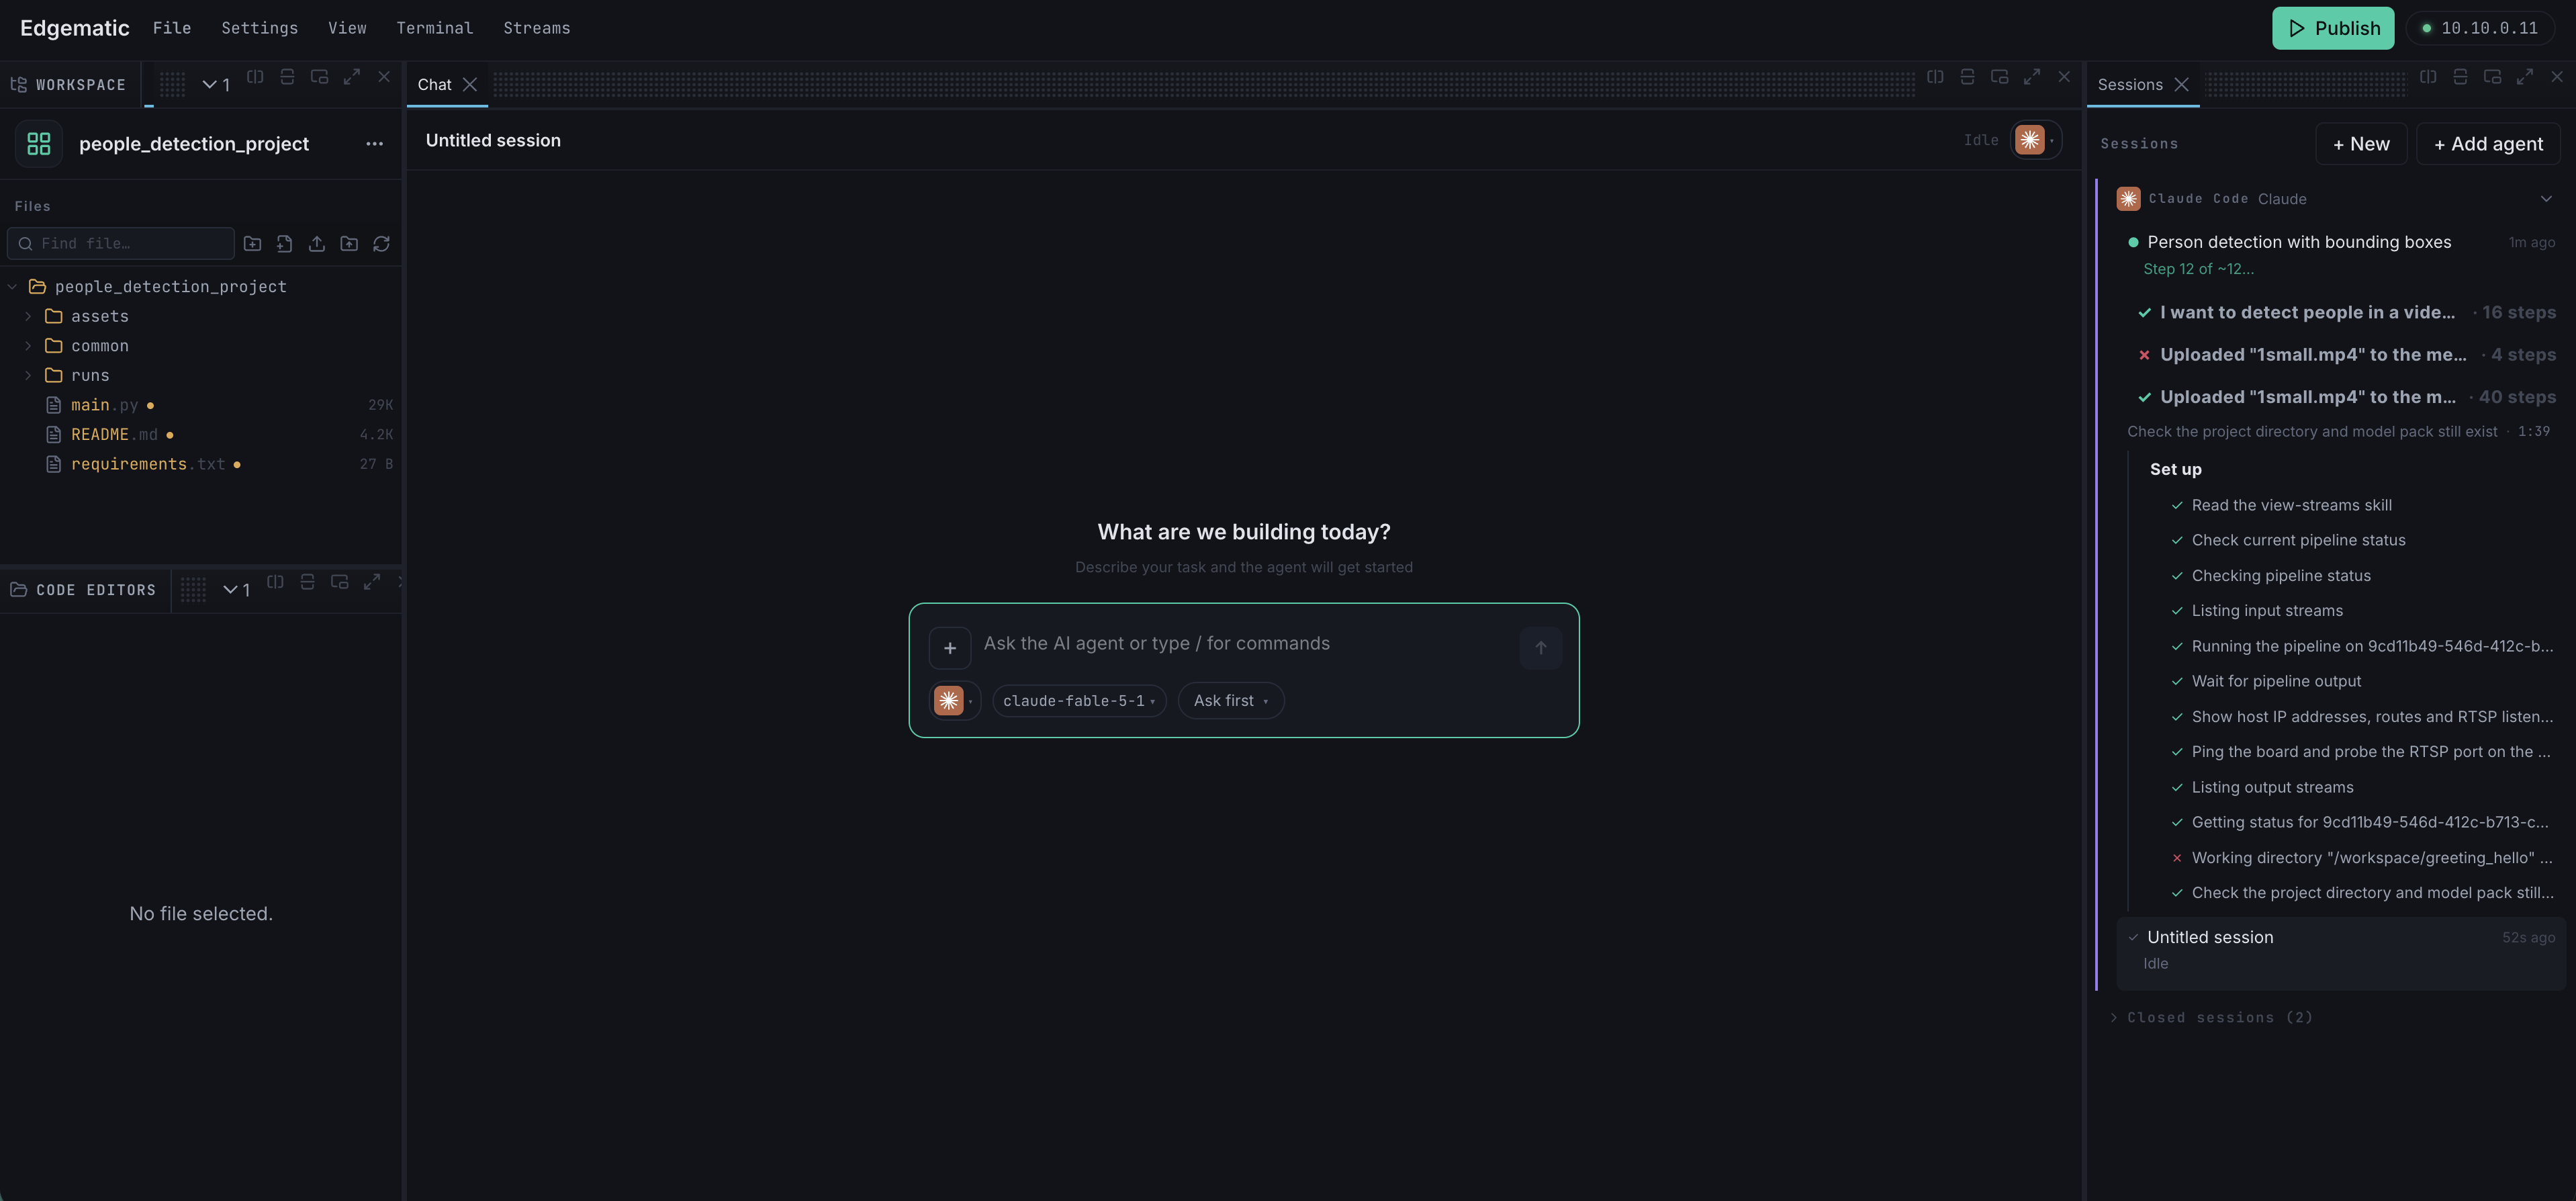
Studio is not limited to one conversation. The right panel lists every session in the workspace, grouped by the agent behind it - for example Claude and OpenAI Codex - so you can run work in parallel and switch between threads.
Each session shows whether it is running, and on which step, or idle. Closing a session pauses it and moves it to Closed sessions, where you can reopen it.
Select a session and the panel shows the detail for that session in three collapsible sections:
- Progress - the phases and steps of the current run, with per-step state (done, running, failed, pending).
- Subagents - work the main agent delegated, including nested delegation, with a detail view for each subagent and a way back to the main session. Recently finished subagents stay listed.
- Skills - the skills this session's agent has opened, with a rendered description for each.
Editor and file explorer
The built-in editor is where you review and change what the agent produced. The file explorer sits beside it with a full context menu - open, create files and folders, copy, duplicate, paste, cut, rename, move, copy path, download, and delete - with keyboard shortcuts for the common actions.
Download. Right-click any file to save it to your computer, or right-click a folder to download it as a zip. The zip is assembled and sent at the same time, so the download starts straight away and there is no limit on how large a folder you can take - a folder of trained models or captured results downloads the same way a single file does. The zip contains exactly what you see in the explorer for that folder. Right-click the project at the top of the explorer and choose Download to take the whole workspace the same way, in a zip named after your project.
Code intelligence
Code completion is backed by language servers and is configured in Settings > Preferences > Code Intelligence:
- A single Autocomplete toggle turns completions on or off entirely.
- Python and C++ toggles turn completions and diagnostics on or off for each language.
Inside the SDK container, Python completions also cover pyneat, the device SDK, so they understand the Neat APIs you are actually calling.
Terminal
Studio has a built-in terminal, so you can run commands, inspect files, and check what the agent did without leaving the tab. It runs in the SDK container, next to your workspace.
To work on the board itself, choose Terminal → Open DevKit Terminal. It opens a shell on the DevKit selected in the top bar, which must be paired first. The connection runs through Studio's own address, so no extra ports need to be opened.
Devices
The top bar lists the DevKits Studio knows about and the Neat version on each one, so you can see at a glance whether a device is ready to deploy to, and install Neat where it is missing.
Pair a new DevKit from the devices control in the top bar; see Common Workflows. Ask the agent about a device's compatibility and it compares the versions and suggests next steps.
Device health
Every device has a health window covering live system load, recent CPU, memory, and temperature graphs, hardware and OS details, and uptime and load.
This is usually the fastest way to check whether the device is the problem.
Streams
Live video from a running pipeline appears in the chat. Open in workspace also opens it in the streams panel, where channels are laid out in a grid that adapts to how many there are.
Show input switches the tiles from the pipeline's output to the source video assigned to each channel, and Show output switches back. The chat and the streams panel each have their own switch.
Streams in the top bar opens a separate page for your media library, RTSP sources, and the video viewer.
Power usage
Ask the agent about power and it reads the board's power rails and reports:
- Total board power - current draw, session average, and session peak.
- Per-rail breakdown - power per rail, so you can see which part of the board is drawing what.
Power readings require the Sentinel service to be installed and running on the device. If it isn't, or the device can't be reached, the agent says so plainly rather than reporting numbers. A rail with no reading is shown as unavailable.
Versions and updates
Studio reports the versions of everything in the bundle. GET /version returns the Studio build, the SiMa CLI version, the model compiler, the SDK release and platform, and each Neat component.
The same information is shown in the About dialog, opened from About in the top menu bar, with the Studio version as the headline, the environment underneath, and the Neat components collapsed by default. Every value can be copied individually, and the whole set can be copied at once. A manual Check for updates action lives in the same place, and Studio also checks in the background every few hours. A Studio pinned to a release tag does not look for newer Studio versions. An administrator can turn update checks off for an installation, for example on a machine without internet access or one set up on a user's behalf; the About dialog then says that update checks are turned off.
Version strings come from different toolchains and use different formats - semantic versions, PEP 440 versions, and branch-and-commit build strings all appear. A component that did not report a version is shown as a dash; it is not an error.
How updating works. Updates are not applied from inside the running container: when a new version is available, Studio shows you the Installer command to run in a terminal on the host. See Install and Upgrade.
Settings
Settings is reached from the top bar. It is where you connect your coding agents, configure code intelligence, and turn on robotics features. Versions and updates are under About, which has its own item in the top bar.